A cosmograph is a graph which is used by a cosmographer to map the general features of the universe. This representation of the heavens and earth tries to explain the universe without crossing over into the science of astronomy or geography. So a cosmograph is part of cosmography and what a cosmographer would use as part of his work.
Beyond cosmography, these types of graphs and charts can be used to frame input and output models or organizations or geographical representations of points of data.
Other Explanations of Cosmographs
Cosmographs are variations of pie charts. Like pie charts, cosmographs are types of graphs that provide information about components, in relation to a whole. However, cosmographs are not as numerical as pie charts. There are different uses for cosmographs.
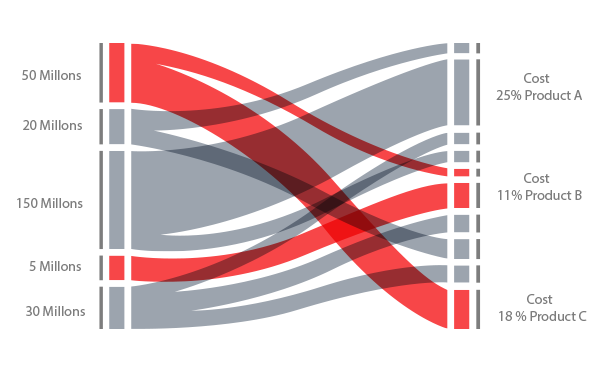
A cosmograph is commonly used to monitor finances. In this context, it is used to track the input and output of a business or organization. Government agencies, for instance, use cosmographs when they want to make a visual presentation about the money that entered the agency and how the amounts were used. Components of input, or income, are listed on the left side of the cosmograph, and components of output, or expenditure, are listed on the right side. The size of each component on a cosmograph corresponds to its value. Larger dollar amounts mean physically larger components. Besides monetary value, an input-output cosmograph can deal with quantity or percentage.
A cosmograph can also be used to show a comparison between geographical regions. Publications frequently feature cosmographs that use different colors to provide information about regions, in respect to a whole. An example of this type of cosmograph is an illustration of the US map with each state in blue, red, or purple, reflecting the dominant political party.