Flowcharts are types of graphs that display a schematic process. Contemporary flow charts are modeled after the logic behind early computer games. Businesses often use them to visually depict all the stages of a project. Therefore, individuals working on a project refer to a flow chart to see the breakdown of the process and understand the whole picture. A flowchart can effectively be used as a training tool for employees who are being introduced to a new project. It also helps in locating and correcting errors in a project. Even though flow chart use is usually linked to the field of business, a flowchart can be used for any purpose that involves a cross-functional process. It can even be used to show driving directions from one location to another.
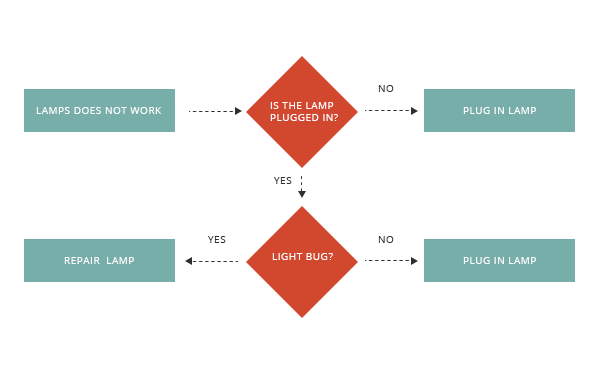
A flowchart consists of start points, end points, inputs, outputs, and routes which are commonly represented by basic symbols that are labeled. Ovals represent start and end points. Rectangles represent the steps of a process, and diamonds represent decisions. Diamonds have two routes stemming from them; one is a true or yes route and the other is a false or no route. Circles stand for operations; arrow-shaped figures stand for transportation, while triangles represent storage, and squares stand for inspection. Arrows linking symbols signify the sequence of a process. While most flowcharts use shapes as symbols, others use graphics instead.