Types of Graphs

GRAPH TYPES – DEFINITIONS AND EXAMPLES
Menu Close
  • Home
  • Pie Charts
  • Pictographs
  • Organizational Chart
  • Flowcharts
  • Cosmographs
  • Bar Graphs
  • Line Graphs
  • Contact us
0

Types of Graphs

Posted on December 8, 2015 by typesofgraphs01
Typesofgraphs

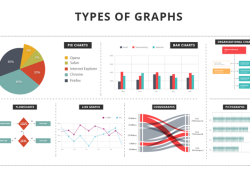
Types of Graphs provides in-depth information about charts & graphs. Graphs are used in a variety of ways, and almost every industry, such as engineering, search engine optimization, mathematics, and education.If you cannot find the information you are looking for,… Continue Reading →

types of graphs
0

Pie Charts

Posted on December 3, 2015 by typesofgraphs01
pie_charth

Pie charts are easy to make, easy to read, and very popular. They are used to represent categorical data or values of variables. They are basically circles that are divided into segments or categories which reflect the proportion of the… Continue Reading →

Pie charts
0

Pictographs

Posted on December 3, 2015 by typesofgraphs01
pictographs

Pictographs, also called pictograms, are diagrams that show and compare data by using picture symbols. Each of these symbols corresponds to a specific quantity and is repeated a number of times. The media often uses pictographs to compare trends; in… Continue Reading →

pictographs
0

Organizational Chart

Posted on December 3, 2015 by typesofgraphs01
Organitational Graphs

Organizational charts, also called organization charts or org charts, are diagrams that reveal the overall structure of the workforce of a company. Through an organizational chart, the formal indirect or direct relationships between the positions in a company are presented.… Continue Reading →

organizational chart
0

Flowcharts

Posted on December 3, 2015 by typesofgraphs01
flowcharts

Flowcharts are types of graphs that display a schematic process. Contemporary flow charts are modeled after the logic behind early computer games. Businesses often use them to visually depict all the stages of a project. Therefore, individuals working on a… Continue Reading →

flowcharts
0

Cosmographs

Posted on December 3, 2015 by typesofgraphs01
Cosmographs

A cosmograph is a graph which is used by a cosmographer to map the general features of the universe. This representation of the heavens and earth tries to explain the universe without crossing over into the science of astronomy or… Continue Reading →

cosmographs
0

Bar Graphs

Posted on December 3, 2015 by typesofgraphs01
Bar Graphs

Bar graphs are used to present and compare data. There are two main types of bar graphs: horizontal and vertical. They are easy to understand, because they consist of rectangular bars that differ in height or length according to their… Continue Reading →

bar graphs
0

Line Graphs

Posted on December 3, 2015 by typesofgraphs01
line_graphs

Line graphs are the most popular types of graphs, because they are simple to create and easy to understand. They organize and present data in a clear manner and show relationships between the data. They are used for personal, educational,… Continue Reading →

line graphs

Types of Graphs Missing Something?

If we have missed a particular type of graph that you were looking for, or there is information missing or incorrect, please contact us

More Info

  • About
  • Privacy
  • Contact us
© 2025 Types of Graphs. All rights reserved.
Desing by Tidesingit.com