Pie Charts
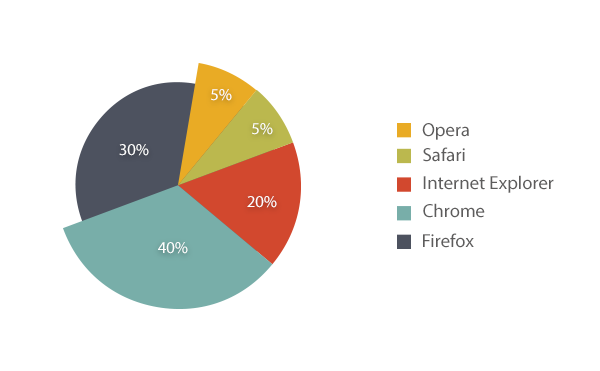
Pie charts are easy to make, easy to read, and very popular. They are used to represent categorical data or values of variables. They are basically circles that are divided into segments or categories which reflect the proportion of the… Continue Reading